

A team running an e-commerce business usually wants the same three things: more sales, better retention and lower ad spend. But shoppers behave differently:
- some buy straight away;
- some abandon the cart;
- some hunt for discounts and wait for a sale.
Show all of them the same offer and conversion stays flat, while campaign efficiency keeps sliding.
Teams normally attack the problem with personalization: they plug in a recommender, send campaigns, launch retargeting. Without proper segmentation none of it works.
To avoid that, we suggest defining key segments from data and behavioural signals. It splits the audience not by abstract demographics but by what people actually do: how they make decisions, where in the funnel they stall, which products they consider but never buy.
The optimal approach is 3–4 segments that cover 100% of the audience. That keeps the strategy manageable and makes metric growth predictable.
How to define key segments: a step-by-step guide
A common mistake is building too many segments at once. It ends in chaos: campaigns get hard to manage, data gets hard to read, and personalization turns into a pile of rules. The right approach is 3–4 segments that cover 100% of traffic.
To work out which segments your team needs, start with basic data analysis. Here is a step-by-step guide to do it efficiently.
Step 1: Identify the key behaviour patterns
Analyse the audience not by age and gender, but by how people make decisions and interact with the site. The core questions:
1️⃣ Which groups of users show similar behaviour patterns?
- Who buys immediately and who deliberates for days?
- Who views many products but never buys?
- Who waits for a discount?
2️⃣ Which actions lead to high conversion?
- Arriving with a specific query and buying right away.
- Reading reviews before checkout.
- Adding to cart and leaving.
3️⃣ Which users most often never reach checkout?
- The ones comparing a lot of products?
- The ones arriving from ads who never click past the landing page?
🔹 What to do at this stage
✅ Collect the core metrics: page depth, number of visits before purchase, share of returning sessions.
✅ Run a behavioural cluster analysis if you have BI tooling.
✅ Pick out the 3–4 patterns that are actually visible in the data.
Step 2: Check segment coverage
Once the patterns are defined, make sure these segments cover 100% of the audience.
📌 Common mistakes:
❌ Segments are too narrow, and 40% of the audience is left “unassigned”.
❌ Groups are too complex — personalization becomes impossible to launch.
🔹 What to do at this stage
✅ Chart how traffic is distributed across segments.
✅ Verify that every user falls into at least one bucket.
Step 3: Test personalization on those segments
With 3–4 key segments in place, start testing hypotheses:
📌 Which personalization strategies fit which segment?
✔ For “fast buyers” — strip down the checkout.
✔ For “discount hunters” — price-drop notifications.
✔ For “value maximisers” — content with a spec comparison.
🔹 What to do at this stage
✅ Set up an A/B test per segment.
✅ Launch the hypotheses.
✅ Track how conversion and average order value move.
Step 4: Optimise and extend the segmentation
After the first round of tests the team sees which segments perform. That is the moment to go deeper:
✔ Add personalization at product-card level.
✔ Tailor promo mechanics and offers to each segment.
✔ Bring in AI models for more accurate behaviour predictions.
🔹 What to do at this stage
✅ Compare metrics segment by segment.
✅ Add new personalization layers gradually.
✅ Watch for new meaningful patterns emerging.
Common segmentation mistakes
Teams repeat the same few mistakes when defining segments:
- Too many segments — the more segments there are, the harder personalization is to manage and the data is to read.
- Mixed criteria inside one segmentation — one segment built on traffic source, another on on-site behaviour. Segments overlap and the numbers stop making sense.
- Ignoring coverage — if segments do not cover 100% of traffic, part of the audience gets no personalization at all.
📌 The main rule: 3–4 segments must cover the entire audience.
A team can start with simple hypotheses, test personalization quickly and then deepen the strategy as data accumulates. That is how you grow revenue step by step, without chaos or overload. 🚀
A worked example: an electronics retailer
Starting point
An electronics store with 1.5M monthly users, 3.2% conversion and a $200 average order value.
The goal
Grow revenue.
Stage 1: Defining the key segments
The data showed four clearly separated behaviour patterns, and the team wrote a hypothesis set for each.
📌 1. “Discount hunters”
➡ Users who look for discounted items and wait for promotions.
💡 Hypotheses:
✔ Surface discount offers and a “Sale” entry in the menu.
✔ Add bold discount labels in the catalogue.
✔ Switch on dynamic sorting — discounted products first.
📌 2. “Value maximisers”
➡ Study products for a long time, compare specs, read reviews.
💡 Hypotheses:
✔ Show a comparison block with the popular models.
✔ Add reviews and key product benefits inside the catalogue.
✔ Pre-set catalogue filters to the parameters they picked before.
📌 3. “Fast buyers”
➡ Arrive with a specific query and buy quickly.
💡 Hypotheses:
✔ Simplify checkout (express payment methods, fewer fields).
✔ Offer matching accessories in the cart automatically.
✔ Add a “Buy in one click” button.
📌 4. “Cart collectors”
➡ Add products to the cart but never complete the order.
💡 Hypotheses:
✔ Show a reminder about items waiting in the cart.
✔ Open the cart straight away on the next visit.
✔ Offer free shipping or a bonus for completing the order.
Stage 2: Testing the hypotheses
In the second stage the team changes the site for each segment to put the hypotheses to the test.
Stage 3: Measuring the lift
📈 “Discount hunters”
✅ Completed orders grew by 18%.
📈 “Value maximisers”
✅ Average order value grew by 15% thanks to dynamic product comparison.
📈 “Fast buyers”
✅ Conversion moved from 3.2% to 4.8% (+50%) after the path to purchase was shortened.
📈 “Cart collectors”
✅ Completed orders grew by 22%, because users got visual reminders.
📌 Overall lift:
✔ Conversion +28%.
✔ Average order value +12%.
✔ Revenue per user +16%.
✔ Revenue +22%.
How can the team keep growing?
While testing hypotheses the team learns a lot about the segments it defined. By analysing which changes drove growth and which underperformed, you can keep testing new hypotheses and refine the segmentation.
Every test feeds the next improvement. If the team notices that “discount hunters” convert better when they see deeper markdowns, it can test personalized promo blocks. If “value maximisers” buy more often after reading detailed comparisons, it can add more expert reviews.
Over time, as the knowledge deepens, the segmentation can get more granular. Inside “cart collectors”, for instance, two sub-types show up:
- The ones postponing the purchase (they visit the cart, do not remove the item and come back to it days later).
- The ones who hesitate (they add the item but keep studying alternative models and reading reviews).
For the first group, urgency mechanics work (a low-stock notice, for example). For the second, help them decide — show reviews and the model rating right in the cart.
📌 The main growth rule is sequence.
After every test cycle the team finds new growth points, ships them, analyses the results again and keeps optimising.
That is how you lift key metrics gradually, improving personalization and user experience along the way. 🚀
How to use segmentation in Gravity Field
Gravity Field gives you audience segmentation tools that account for behaviour, preferences and user affinity. That data drives dynamic content personalization, catalogue adaptation and UX changes directly on the site.
Let us walk through the segments you can build and how to personalize the experience without email campaigns or external communications.
Audience management
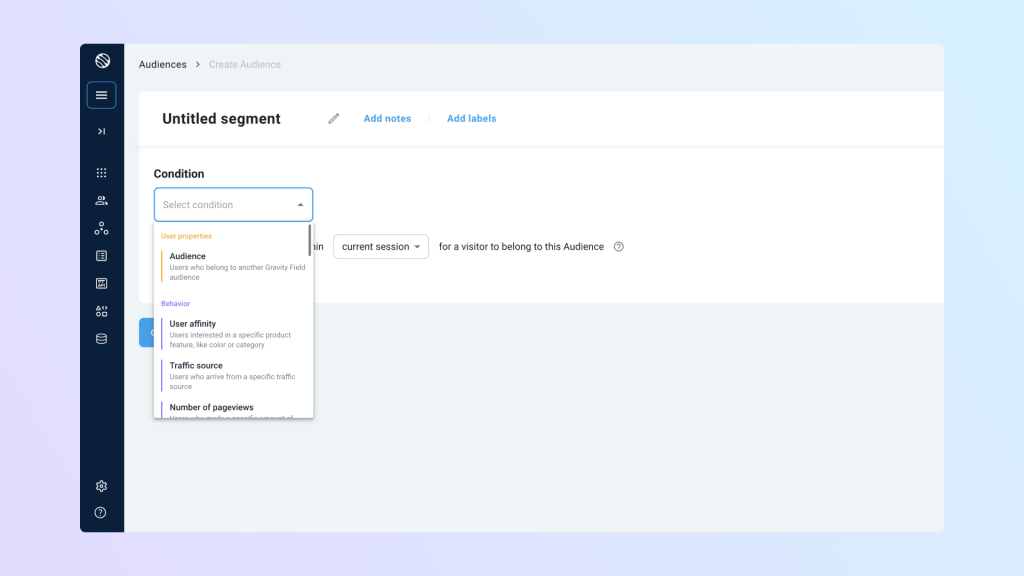
This tool builds audiences from specific conditions and user actions: traffic sources, on-site behaviour, device parameters and other factors. Read the docs
📌 1. “Left without buying”
➡ Users who added products to the cart but did not check out within 24 hours.
💡 Hypotheses:
✔ Keep the cart items pinned on the next visit.
✔ Show a reminder block with the items and a “Complete order” button.
✔ Shorten the path to purchase — open the cart page as soon as they return.
📌 2. “Category interest”
➡ Users who viewed 3+ products in one category without buying.
💡 Hypotheses:
✔ Raise that category in the menu on the next visit.
✔ Show a personalized selection from that category in the “Recently viewed” block.
✔ Reorder the catalogue so the most relevant products come first.
📌 3. “High activity, low LTV”
➡ Users who visit often (5+ sessions in two weeks) but rarely buy.
💡 Hypotheses:
✔ Add stronger trust triggers: reviews, guarantees, certifications.
✔ Restyle the CTA buttons to put more weight on the offer.
✔ Show popular or fast-selling products in their favourite category.
📌 4. “New users with high engagement”
➡ First-time visitors who spent more than 5 minutes on site and viewed 5+ pages.
💡 Hypotheses:
✔ Show an interactive widget for quick product discovery.
✔ Offer a short quiz or configurator that helps them choose.
✔ Swap banners and recommendations to the subcategory they were browsing.
📌 5. “Mobile-first customers”
➡ Users who arrive from mobile devices in 90% of sessions.
💡 Hypotheses:
✔ Simplify the mobile interface: bigger CTA buttons, fewer elements.
✔ Add express checkout via Apple Pay and Google Pay.
✔ Make the catalogue more compact and easier to scroll.
Affinity audiences

This tool detects user preferences for specific product attributes: brands, categories, styles, colours, price tiers and more. Read the docs
📌 1. “Premium brand lovers”
➡ Users who browse and buy only in the premium tier.
💡 Hypotheses:
✔ Push premium brands up in product listings.
✔ Show fewer discounted items, lead with new arrivals and exclusives.
✔ Tune recommendations: trending models instead of bestsellers.
📌 2. “Discount hunters”
➡ Users who mostly buy items with deep discounts (20%+).
💡 Hypotheses:
✔ Add bold discount labels straight into the catalogue.
✔ Prioritise the “Deals” section on every visit.
✔ Personalize the “Recommended” block to discounted products only.
📌 3. “Brand loyalists”
➡ Users who consistently browse one brand.
💡 Hypotheses:
✔ Put that brand first in search results and recommendations.
✔ Highlight the brand’s advantages on product pages (series, exclusive colours).
✔ Swap home-page banners dynamically based on their preference.
📌 4. “Category devotees”
➡ Users who regularly buy from one category (running shoes, for example).
💡 Hypotheses:
✔ Lead with new arrivals and bestsellers from that category.
✔ Build the “Personal recommendations” block from that segment only.
✔ Adapt catalogue filters — offer the parameters that matter in that category first.
📌 5. “Attribute-driven shoppers”
➡ Users who pick products by a specific attribute (only black items, or phones with 256GB of storage).
💡 Hypotheses:
✔ Apply catalogue filters automatically to match their preference.
✔ Suggest similar products with the attributes they care about.
✔ Optimise product pages — highlight the attributes that matter to them (colour, storage, screen size).
Takeaways
If a team defines 3–4 key segments that cover 100% of traffic and adapts the UX for each, it can lift key metrics gradually, improving personalization and user experience along the way.
📌 The main segmentation rules:
✔ Stick to 3–4 segments so personalization stays manageable.
✔ Avoid overlaps so the strategy stays readable.
✔ Test UX changes and track their impact on metrics.
✔ Use AI and automation for dynamic personalization.
That is how you grow revenue, lower acquisition cost and build an experience customers actually enjoy. 🚀


